In case you missed last night’s webinar on 15-Minute Cities, this blog post summarises the presentations by Alice Roberts from CPRE London and Jeremy Leach from London Living Streets.
Alice Roberts: Planning for sustainable transport
At CPRE London we talk a lot about development because there’s a strong relationship between development and land use. Today, I want to talk about density as this is a common issue around London. We have spent a long time, in Enfield for example, looking at issues around densification and finding space to build. I’m talking about the interplay between density, green spaces – including the green belt – and transport.
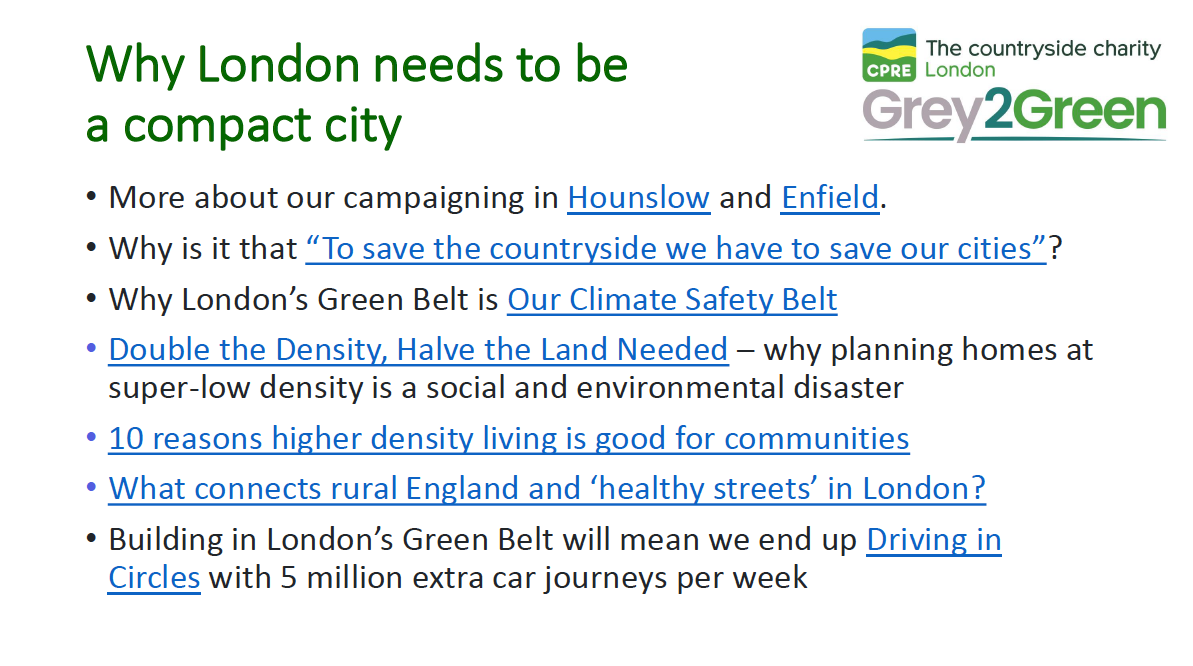
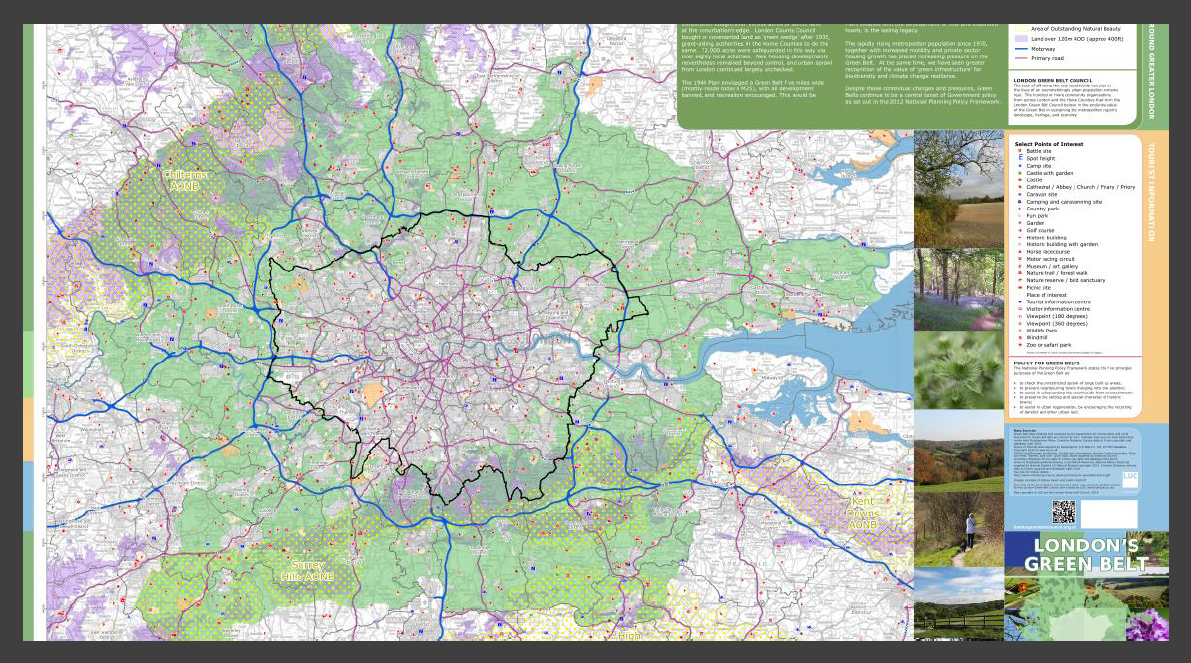
At the heart of urban planning you’ve got a choice. You can have a sprawling city that tends to be low density, which is high-carbon by definition because more things have to move around further, and they tend to move around by car. The sprawling city is characterised by less active lifestyles because people are using cars. We call this a ‘climate unsafe’ environment because that is high-carbon. A compact city, on the other hand, will have something constraining development around it, like a green belt, so that it does not sprawl into the countryside. It’s more likely to be high-density development, lower-carbon, it would rely more on public transport, walking and cycling. Public transport is more viable as density increases, and more walking and cycling in a higher-density environment supports health. We call this a ‘climate safe’ environment because it is lower carbon. Slide 3 shows London’s Green Belt – the green areas are very important, and if you can see Bromley in the south east, it has a a lot of green belt area.

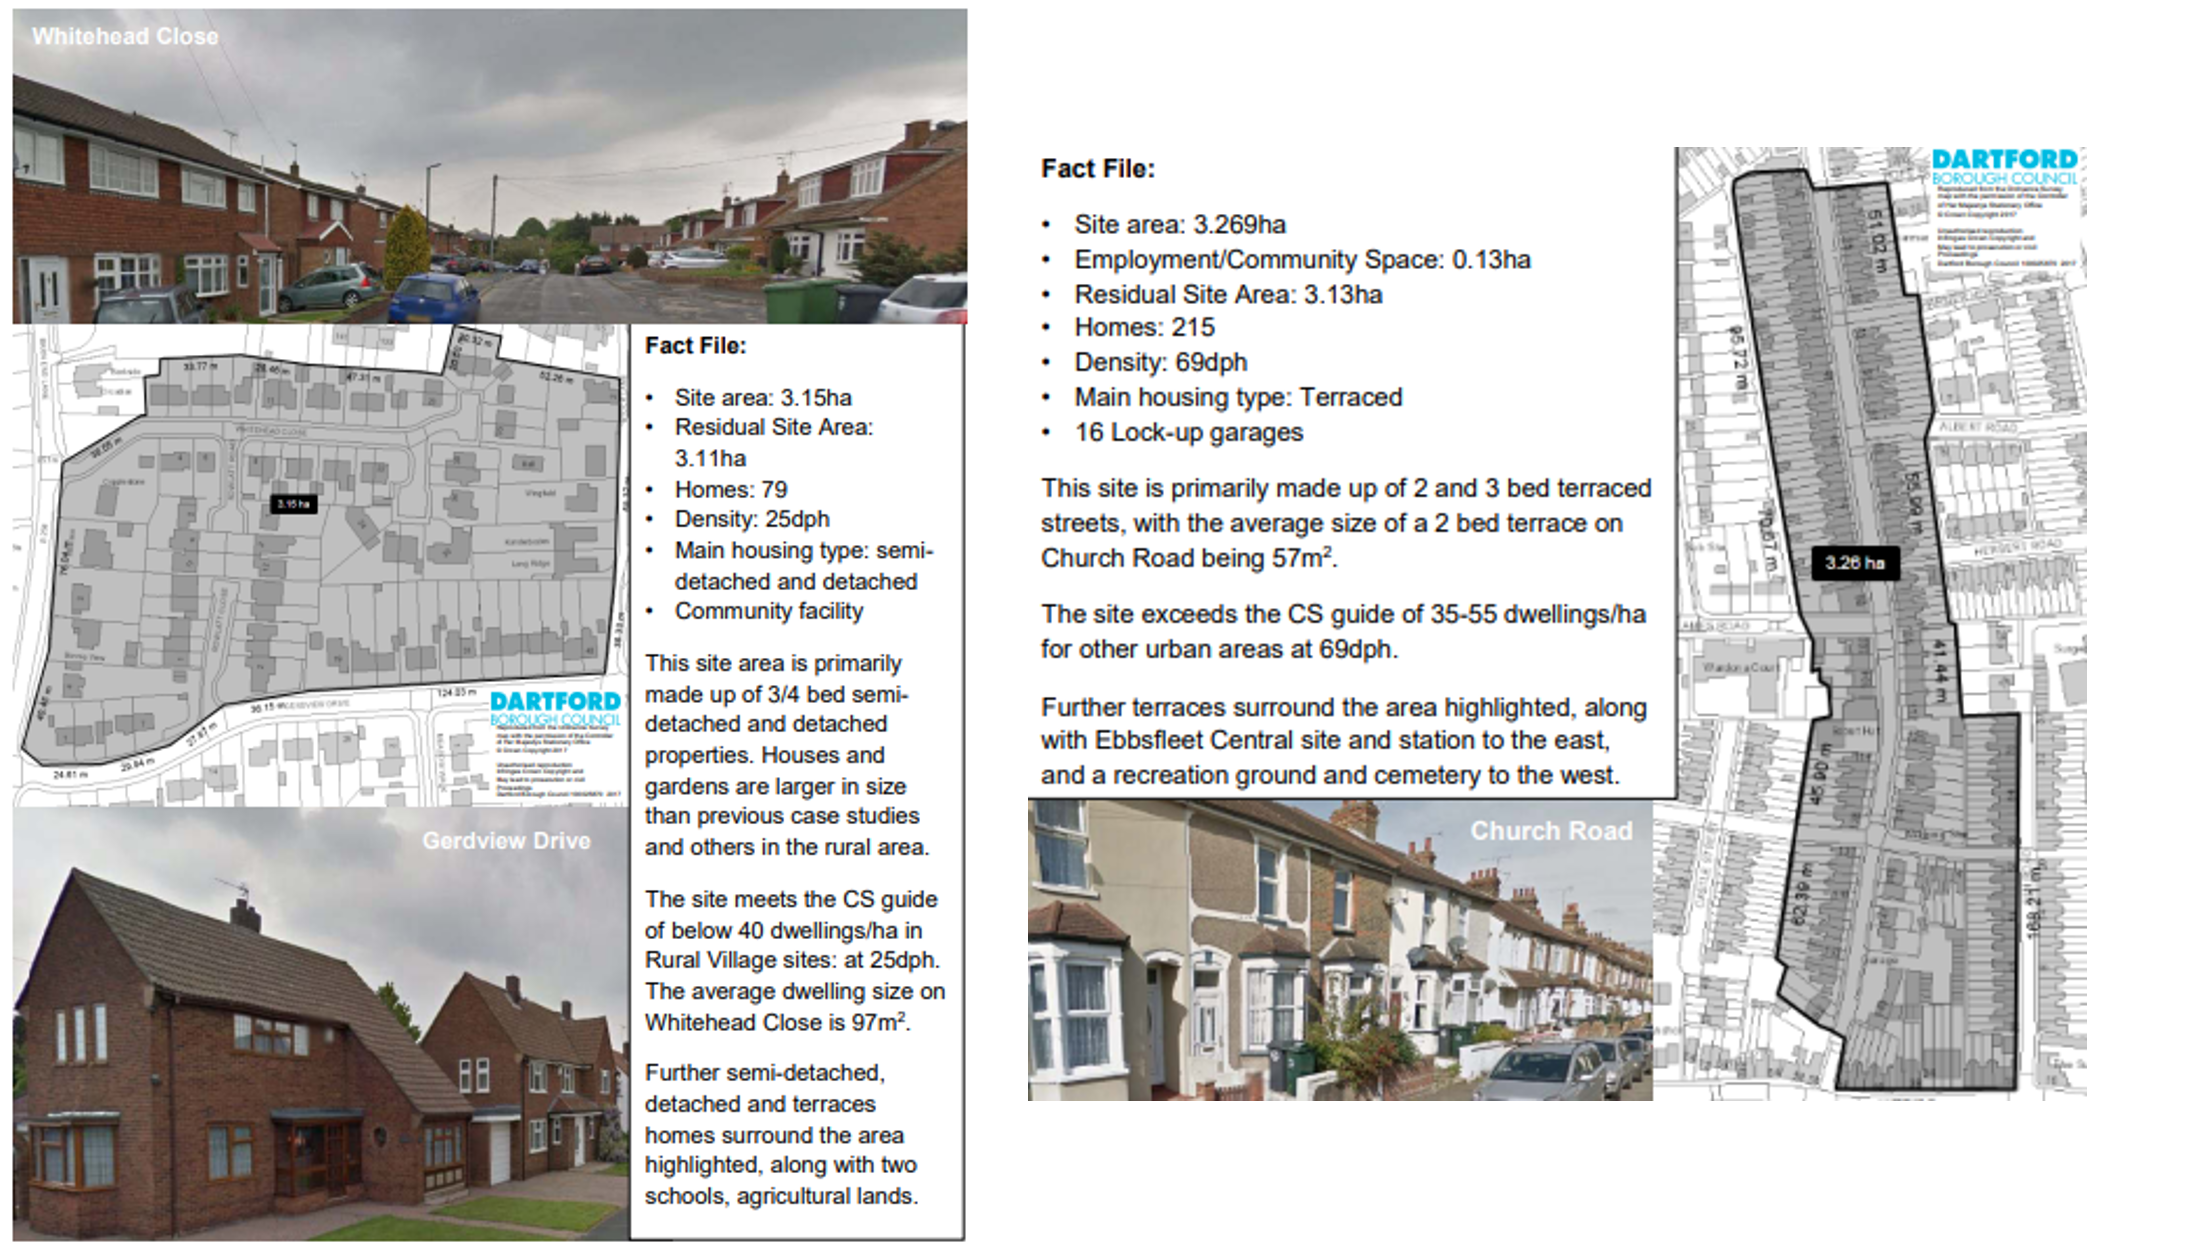
Moving to the density issue, the photos on Slide 4 are from Dartford. They show interesting densities – on the left you’ve got something with 25 dwellings per hectare and on the right, 69 dwellings per hectare. Neither have blocks of flats or tower blocks, but there’s a huge difference in density. The most important thing to remember is that anything below ~60 dwellings per hectare means that you cannot support public transport well. Ideally, you’d be up near to 100, but 69 dwellings per hectare is at least able to support a bus service to be financially viable.
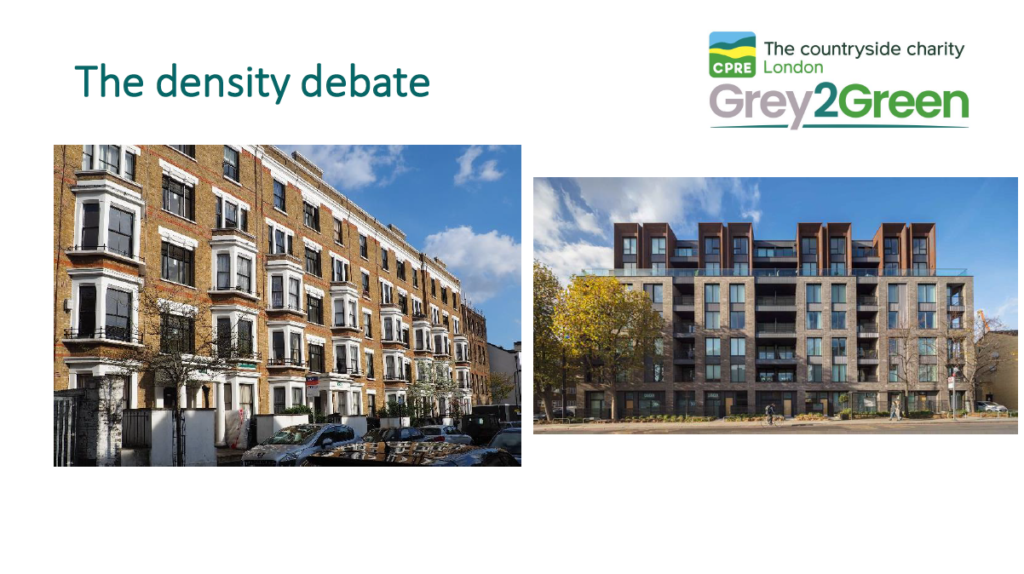
The density debate is strong, particularly in outer London boroughs. Density is not a new thing. These two pictures on Slide 5, one old and one new, are high density but not necessarily what comes to mind when people struggle with the idea of density. They’re often thinking about high rise blocks, and frankly, in many cases that is what’s happening. We don’t support that, mostly because it’s not popular in many areas, but also it’s not a great way for families to live, in a very large high rise block.
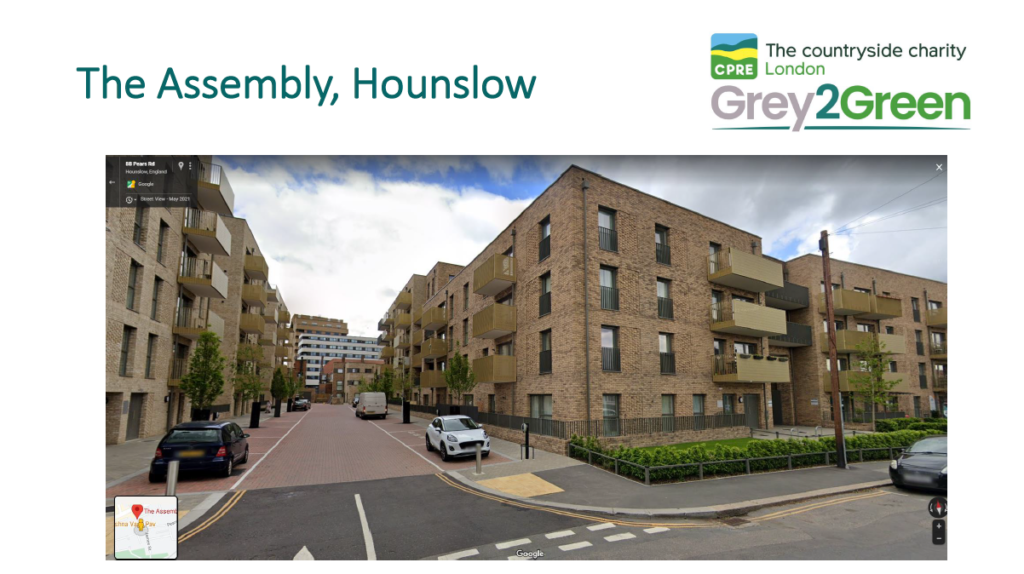
Slide 6 shows a site in Enfield that will be developed, clearly showing the links between land use and transport. There is a car-dependent retail centre on the A10 in Enfield with a vast area of surface car-parking that encourages car trips and is a poor use of space. We’re trying to move to a situation where people need to make fewer car trips, and one of the ways to do that is by increasing density. This development will likely convert a large car park to a very high-density development – much higher than we or local campaigners support in that area. We think they could have got a lot of housing build without tower blocks, but that’s a separate story. Slide 7 shows an example of what we might support. The Assembly in Hounslow is 4 stories, and it is a car-free development. This means that people who live here cannot get a car parking permit, except for disabled residents, so you’re not adding cars to the local streets as a result of the development.

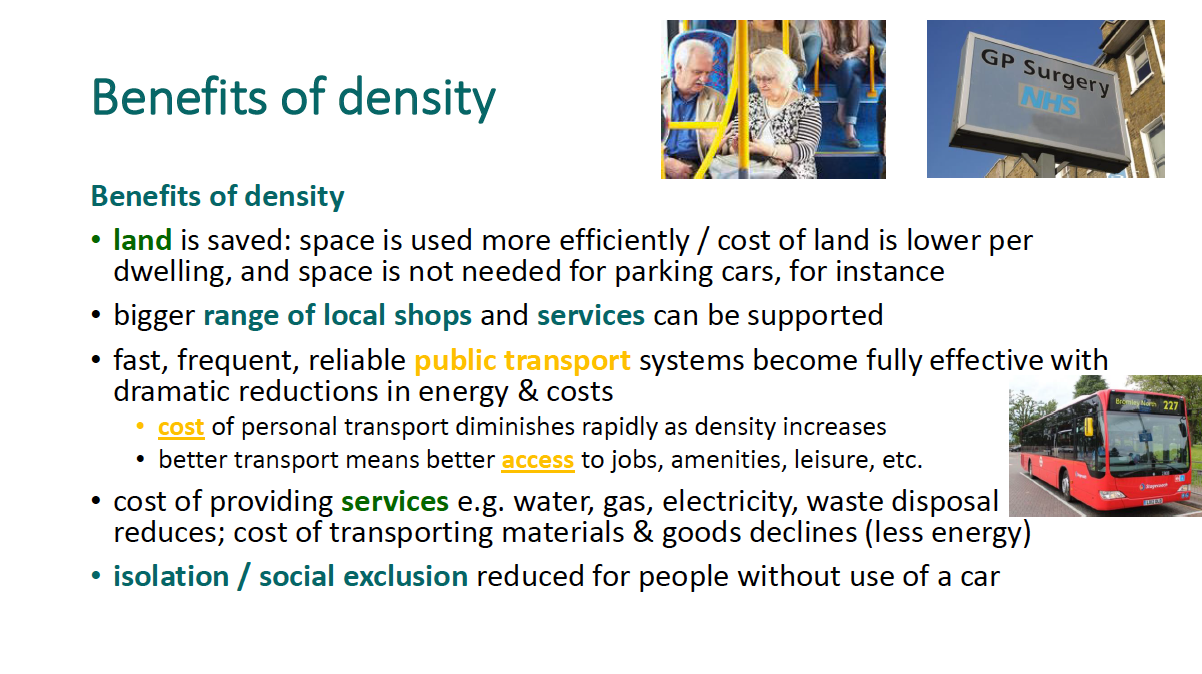
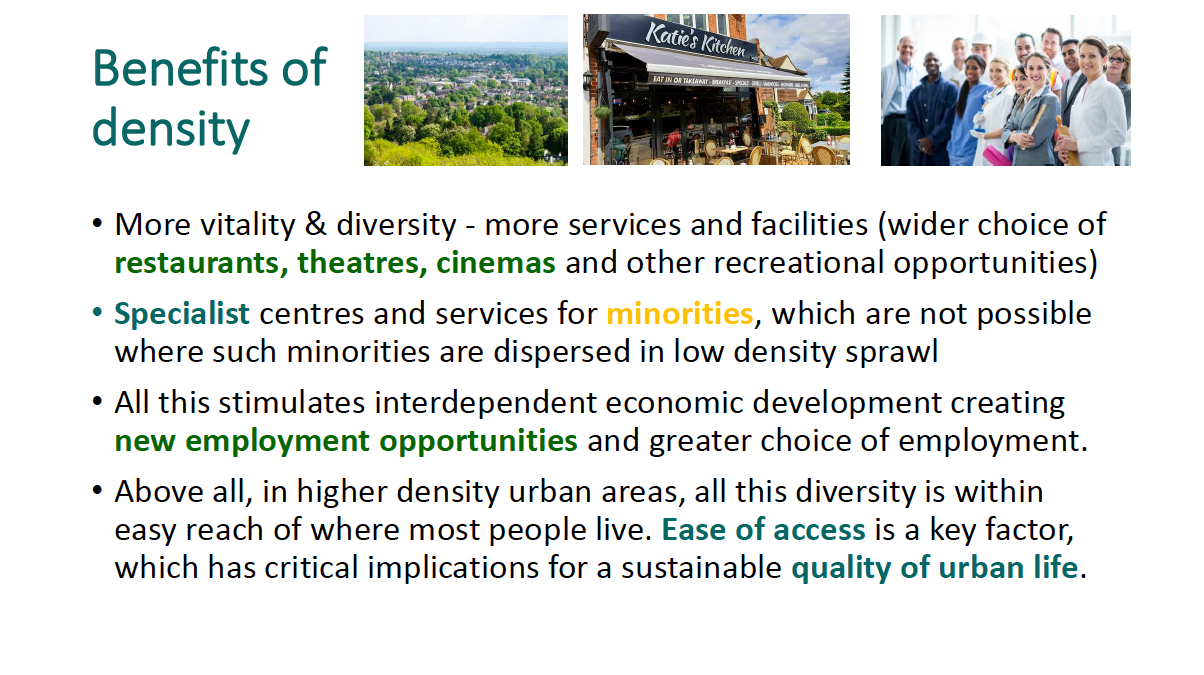
Slides 8-9 show how density has benefits. Land is used more efficiently – the land cost is lower per dwelling, partly because space is not needed for car parking, but also because you may have 3-4 dwellings on different stories. A wider range of shops and services can be supported, and critically, people benefit from faster, more reliable and frequent public transport systems because they become more effective in energy and cost. The cost of personal transport also diminishes as density increases, and better transport means better access to jobs and leisure, partly because higher densities can support those services. The cost of providing services also declines, as does isolation and social exclusion for people without a car. Density enables greater vitality and diversity, more services and facilities, a wider choice of restaurants theatres and cinemas may be available. Above all, in higher-density urban areas, this diversity is within easy reach of where most people live, so ease of access is a key factor which has critical implications for a sustainable quality of urban life.
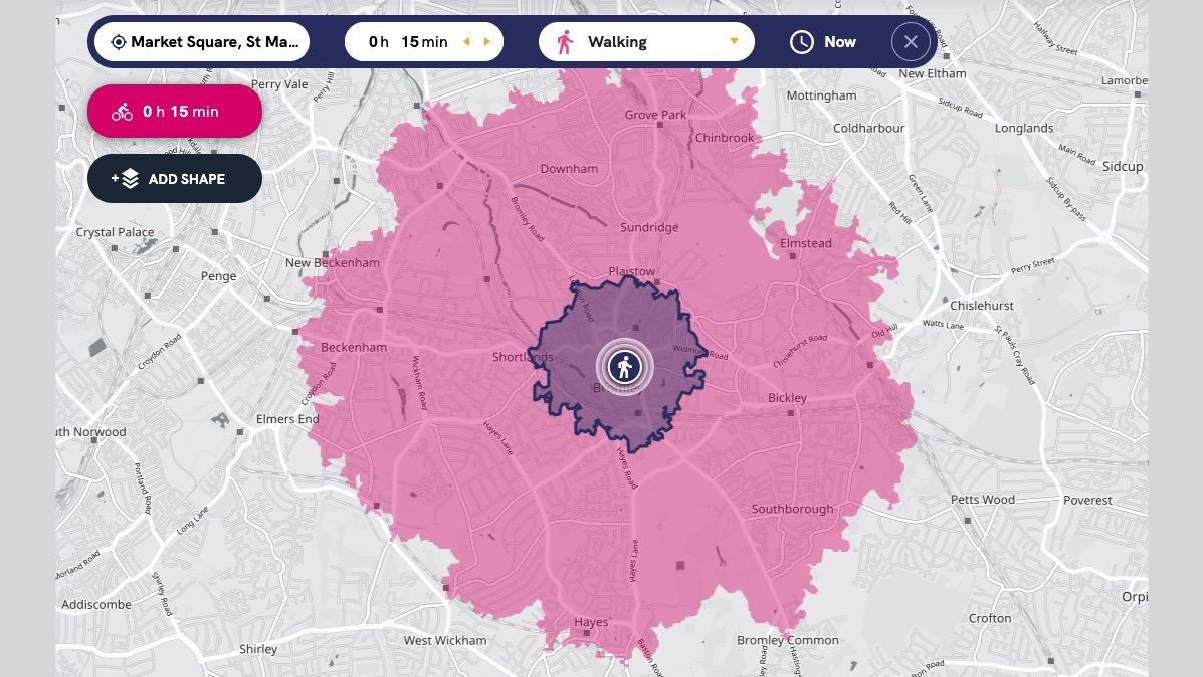
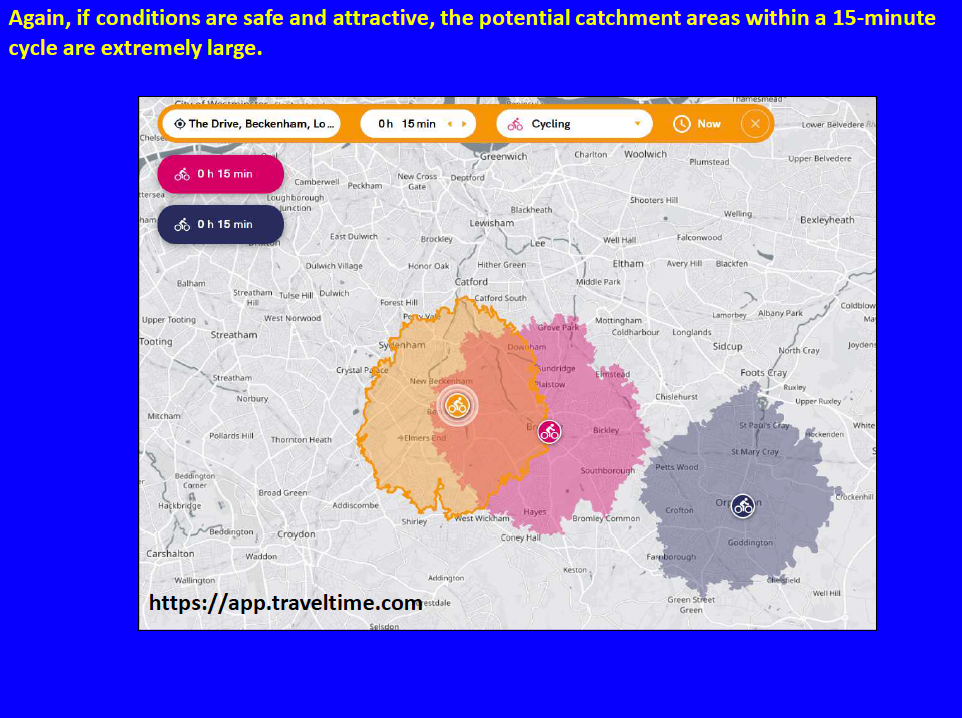
Let’s think about what a 15 minute walk looks like in an area like this – Slide 10 shows a 15 minute walk from Bromley centre, in purple, and the pink area is a 15 minute cycle. If you’re talking about a 15 minute city, it needs to be 15 minutes walking really, either intensifying smaller centres to improve their viability or focusing on larger town centres. You can do it one way or another, but the housing has to go somewhere. While we don’t support the huge targets that councils are being given, we need to get on board with findings space to build. The choices are about, do we densify neighbourhood centres, do we densify town centres within Bromley, or what do we do?
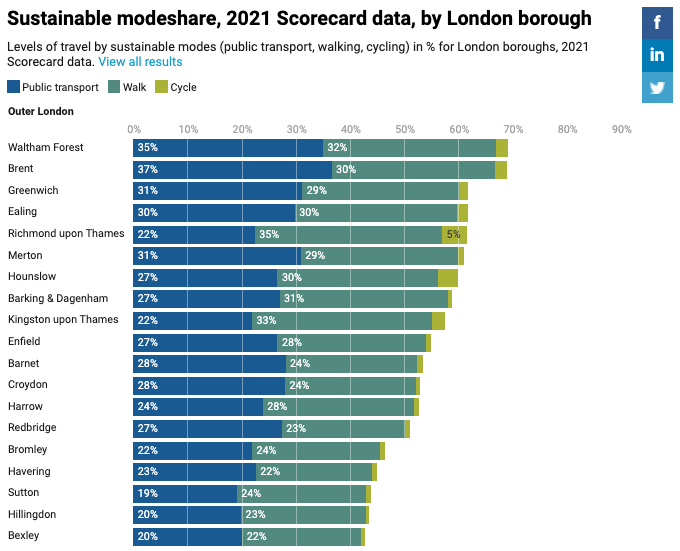
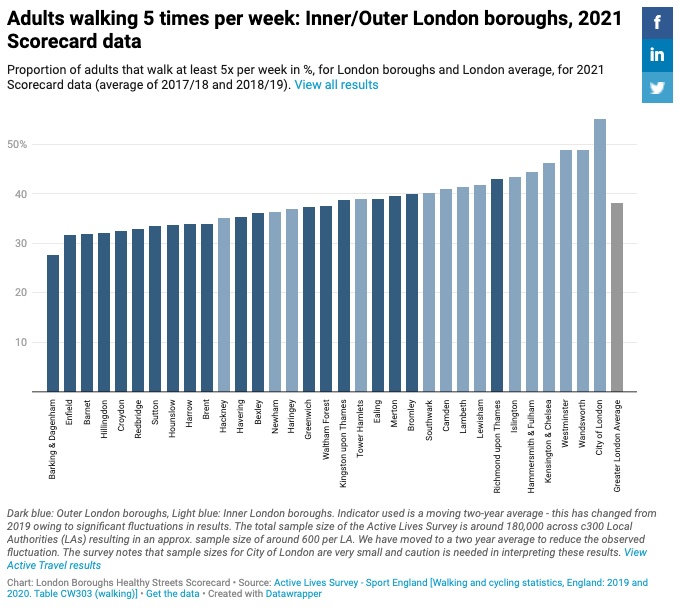
People often don’t realise that a quarter of houses in Bromley don’t have access to a car. That is one of the lower figures, but it is still a lot of households. Those residents will be served better if they can move easily by public transport, walking and cycling to access local shops and amenities. Slides 11-12 come from the Healthy Streets Scorecard project. Slide 11 shows that the sustainable mode share, the proportion of trips by public transport, walking or cycling, is low in Bromley – just below 50%. That is a problem, so, as London densifies we cannot put more cars in. We need to think about how we can shift people from car journeys, not necessarily from owning cars but from using them so frequently, to public transport, walking and cycling. Thinking about how density interplays with that is important. Slide 12 shows that interestingly, the number of adults walking regularly is high in Bromley. It compares for instance with Southwark, at 40%. While it needs to be higher for people to be healthy, it was interesting that Bromley residents are already walking a fair amount, even though there are a large number of car journeys and cars in the borough.
To conclude – this is a picture of what we might like to be working towards, a vibrant neighbourhood centre that is attractive, sustainable and viable.
Jeremy Leach, London Living Streets: 15-Minute Cities for Bromley – Making Bromley a Great Place for Active Travel
I’ve looked at Bromley as a borough, but particularly at Beckenham, Bromley and Orpington in relation to active travel – walking and cycling – and how that complements the idea of compact living. Living Streets was formed as the Pedestrians Association in 1929, London Living Streets is an umbrella for the borough groups across London, formed in 2016. London needs to became a liveable city, a walking city, and inclusive city and a healthy city and a safer city. We’re advocates for walking, but also strong advocates for great places.
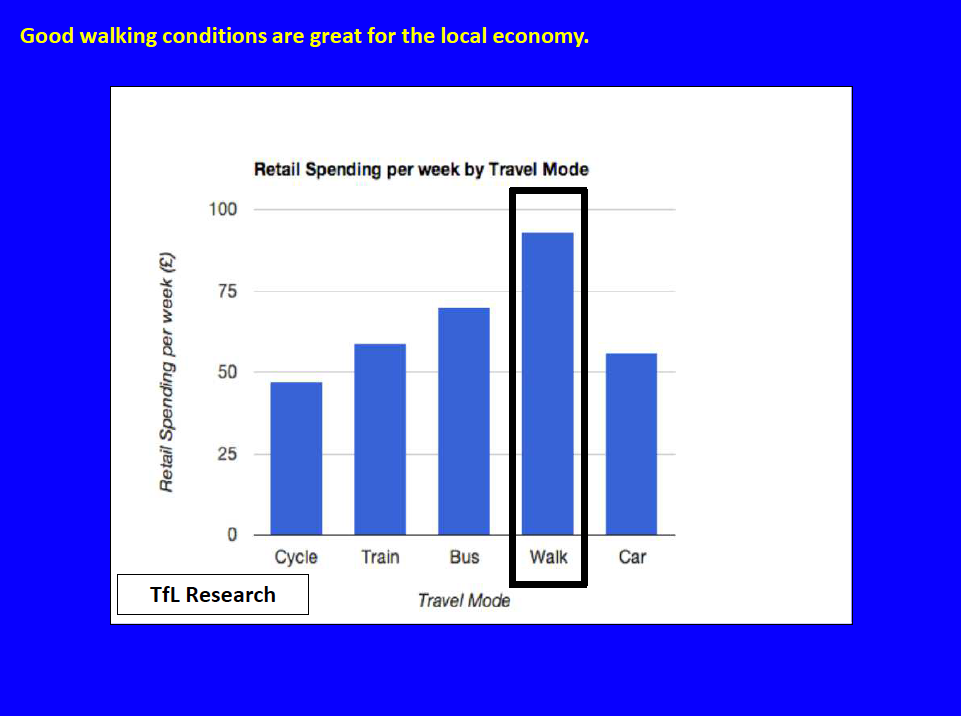
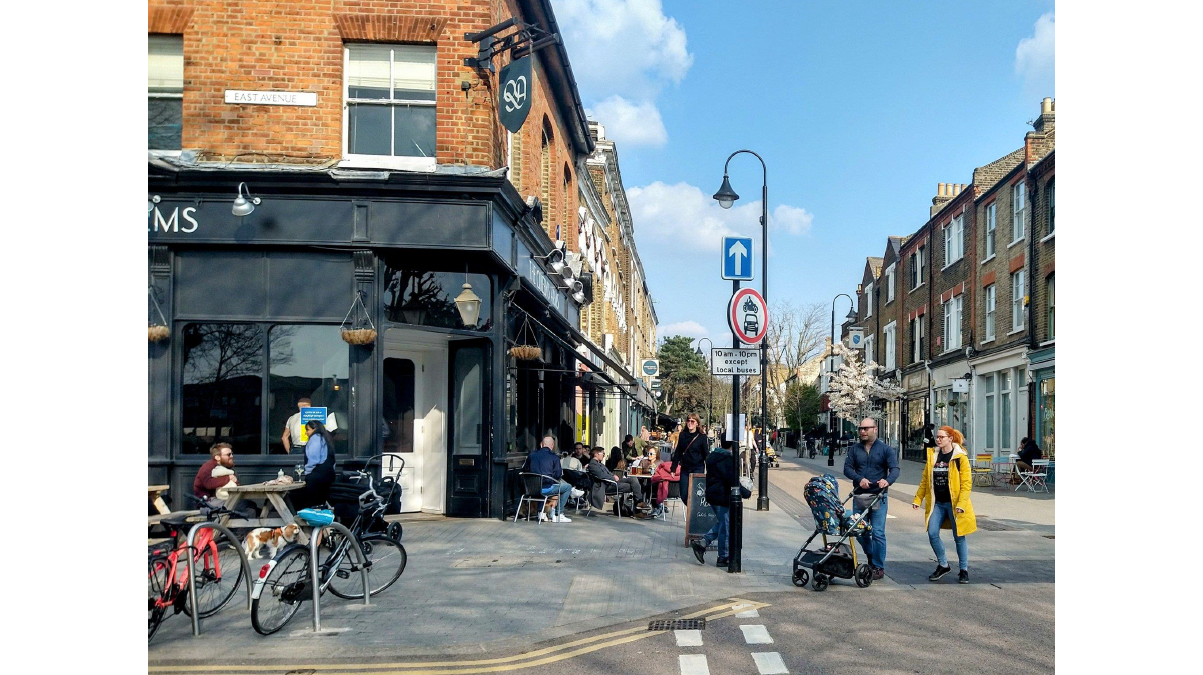
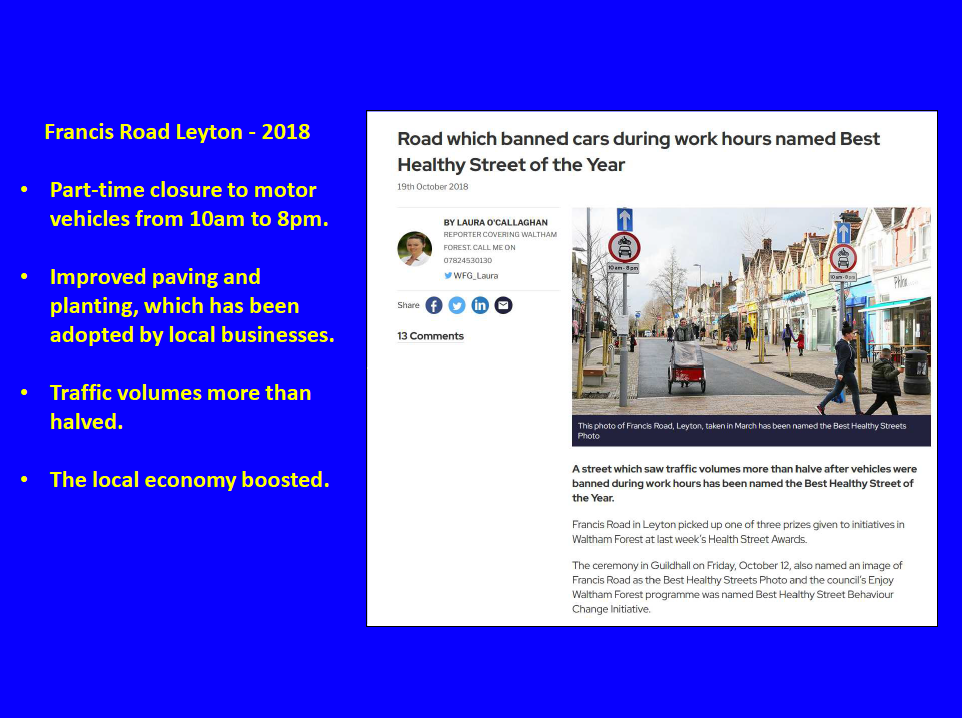
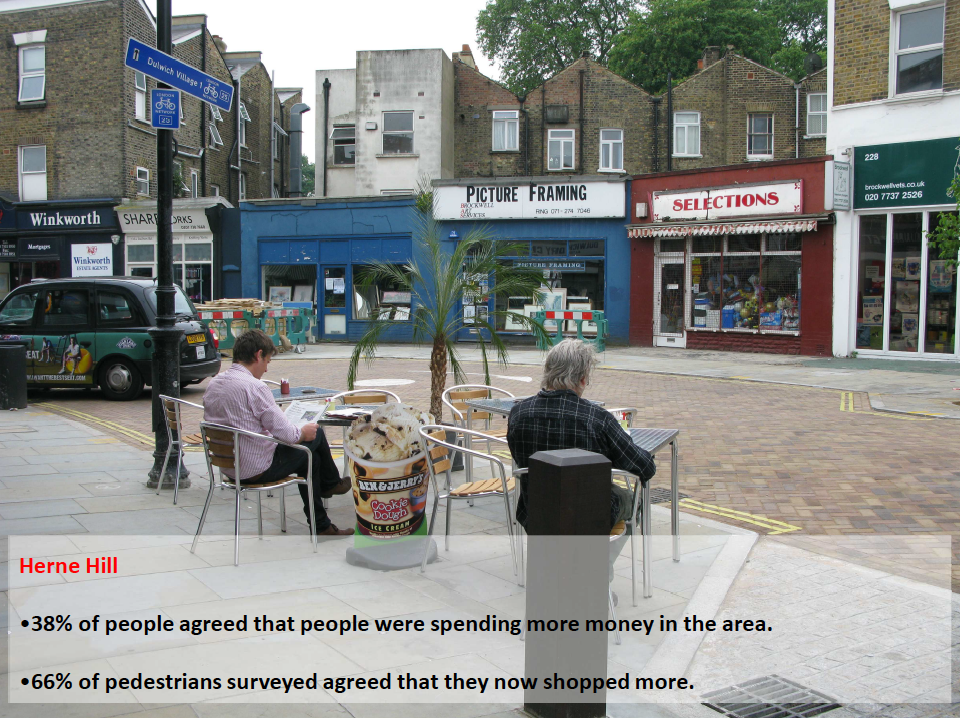
Slide 3 shows a nice example Waltham Forest in outer London, Francis Road in Leyton. In 2018 they won awards based on the transformation of a relatively unsuccessful local shopping parade, by closing it to motor traffic from 10am-8pm and making significant public realm improvements. These changes were taken on board by the local businesses, traffic volumes more than halved and the local economy boomed. Slide 4 shows another example of pedestrianisation scheme around Herne Hill station, where 2/5 of people agreed that people were spending more money in the area and 2/3 of pedestrians said they shop more in this location. There’s much more data on the impacts of street upgrades on job creation and the local economy, see the work that Living Streets have done on the Pedestrian Pound.
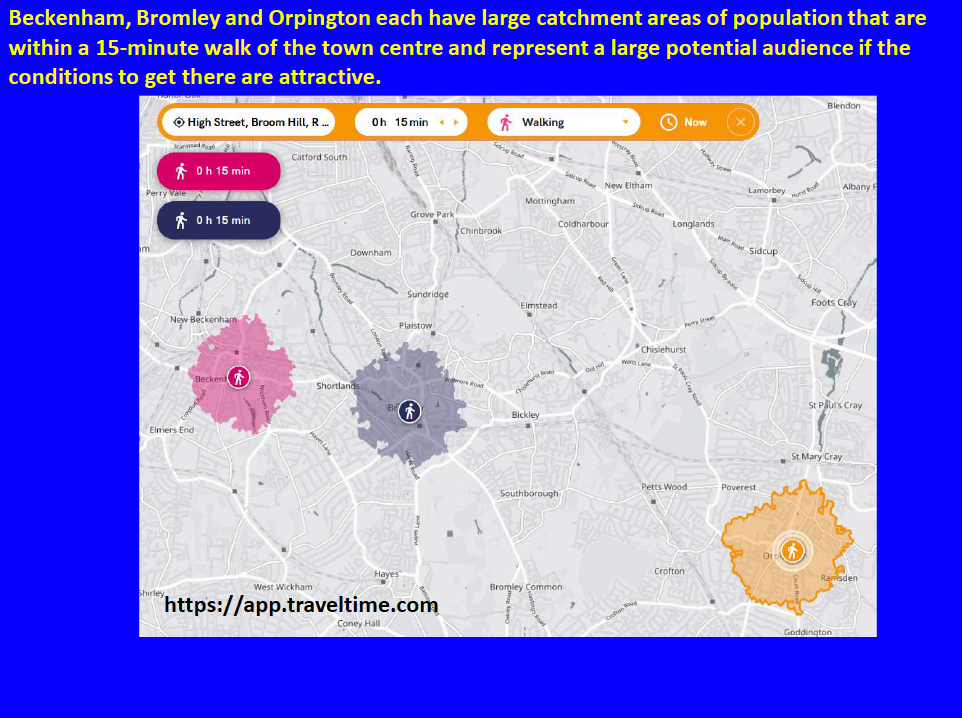
What’s the position around Bromley? Beckenham, Bromley and Orpington have large catchment areas within a 15-minute walk of the town centre (Slide 5). If it’s safe and convenient to walk and visit on foot, local centres can attract large numbers of residents. For cycling, Slide 6 shows huge potential to attract people to these three town centres if we can make cycling conditions better.
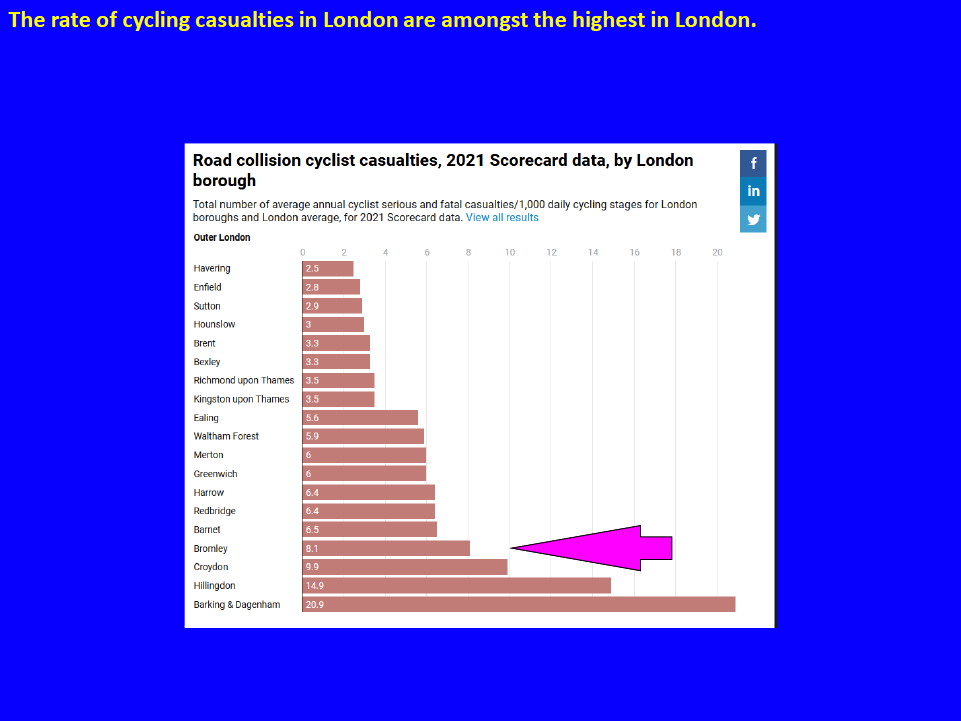
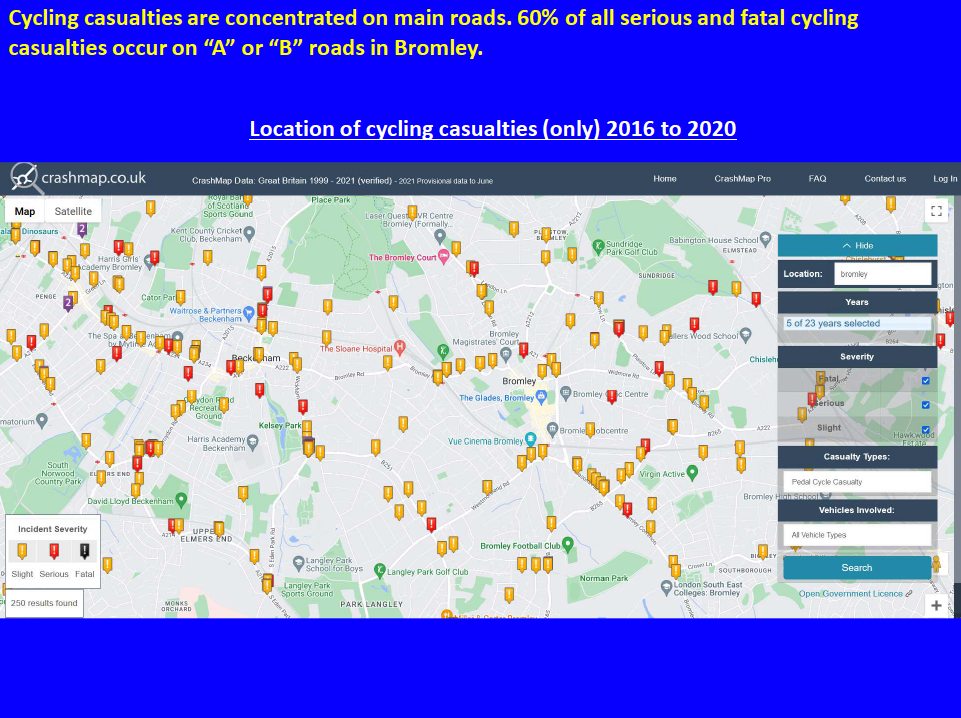
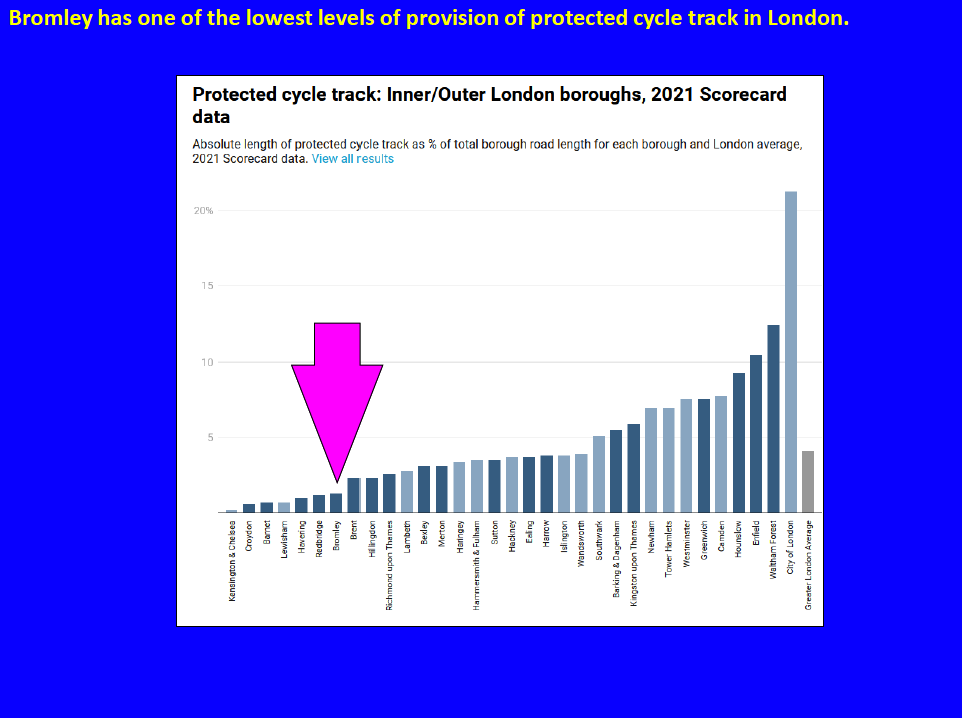
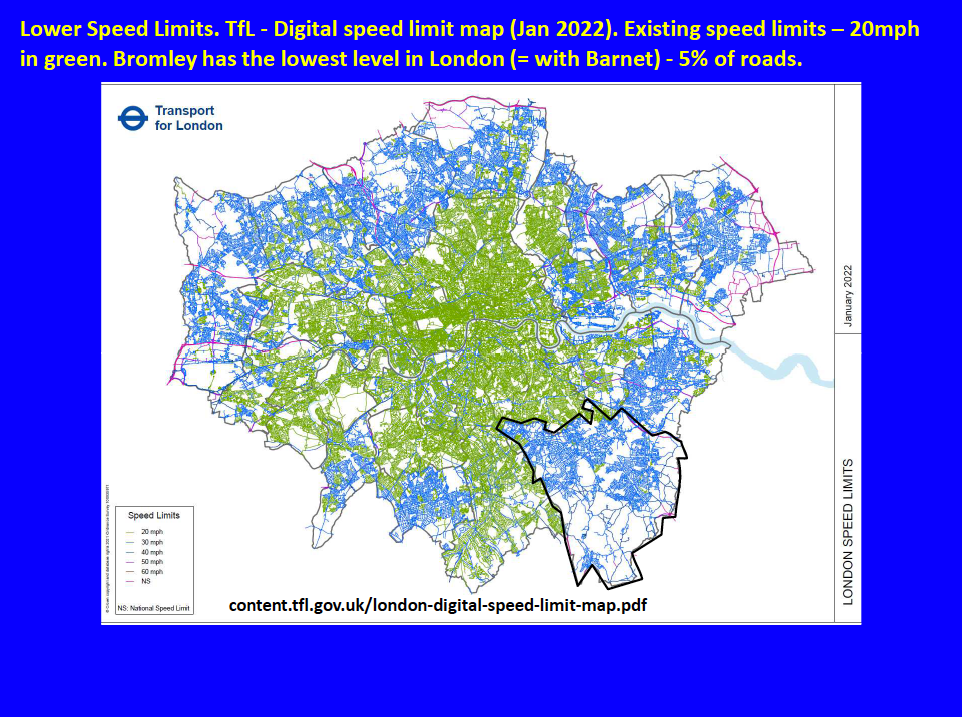
However, levels of cycling in Bromley are amongst the lowest in London, with under 2% of people cycling five times per week. Slide 7 shows that the number of casualties per cycling journey made in Bromley are amongst the highest in London. Slide 8 shows the patterns of where casualties occur – concentrated on the main roads. Almost 2/3 of serious or fatal cycling casualties in Bromley occur on A and B roads, and you can see those patterns clearly in the north of the borough on that East-West axis around Beckenham, based on data from 2016-2020. Slide 9 shows the lack of infrastructure for cycling, so it’s almost a self-fulfilling prophecy, as Bromley has some of the lowest levels of provision of protected cycle tracks and the lowest rates of cycling. Looking at speed limits, Slide 10 shows TfL’s speed map from January 2022, with every street in London identified by the speed limit and 20mph speed limits in green. Bromley has the joint-lowest level in London, equal with Barnet, with 20mph limits on only 5% of its roads. Most of inner London and also a number of outer boroughs have adopted 20mph speed limits, such as Croydon, Waltham Forest, Hounslow, Ealing, Richmond and Kingston.
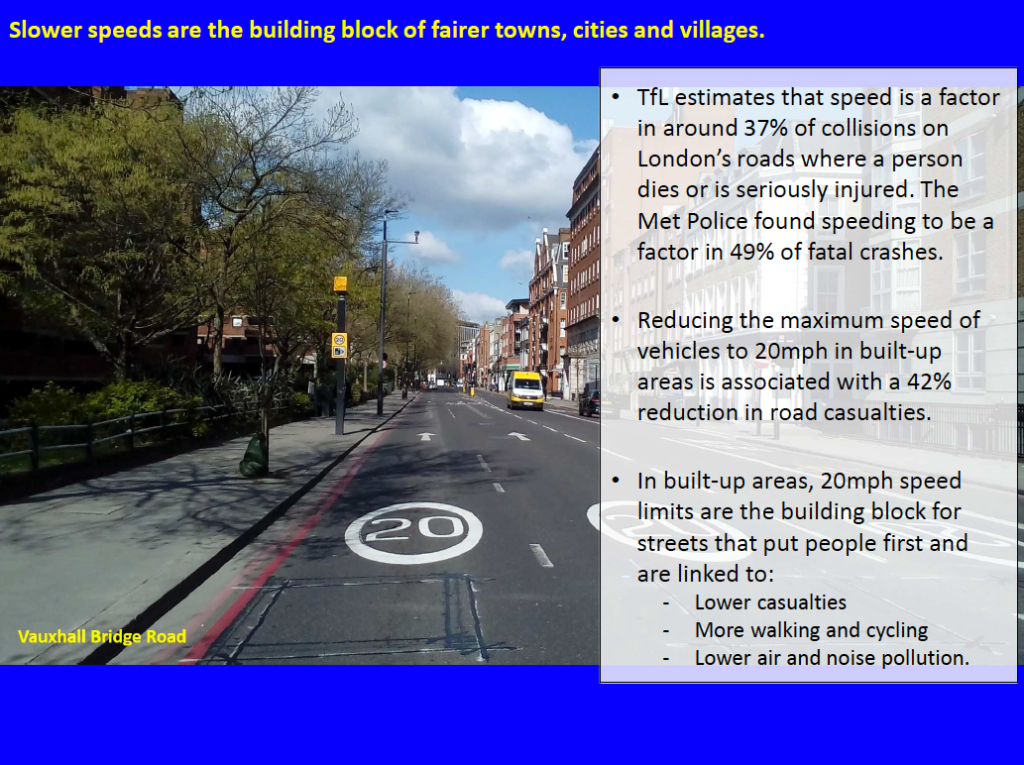
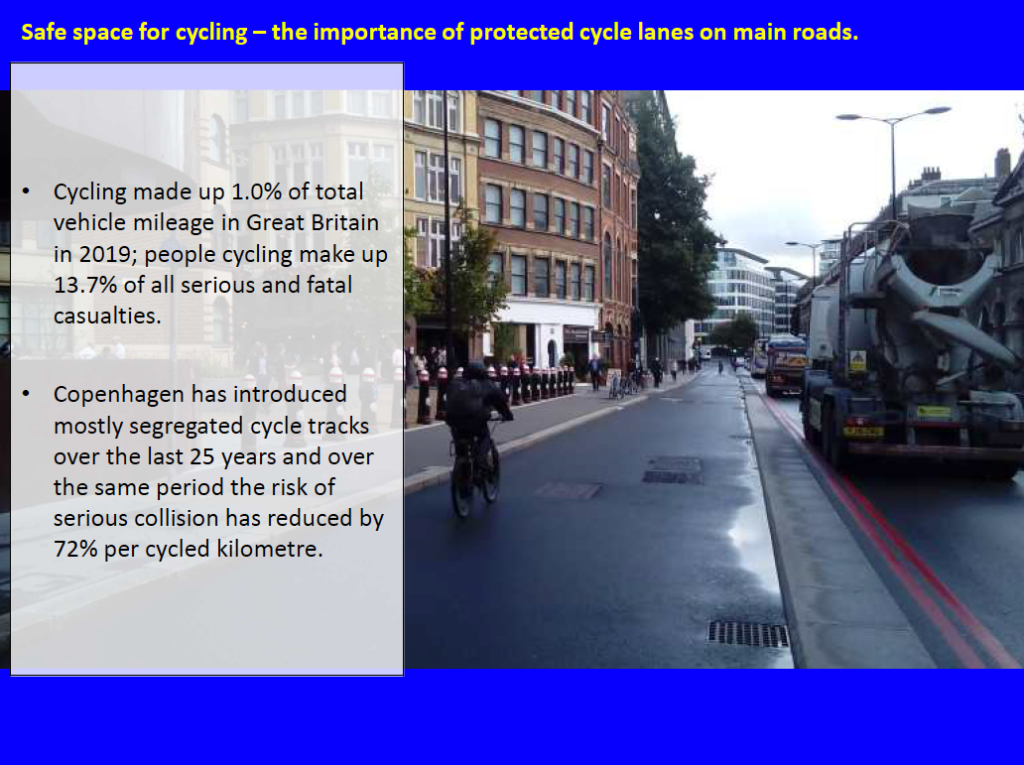
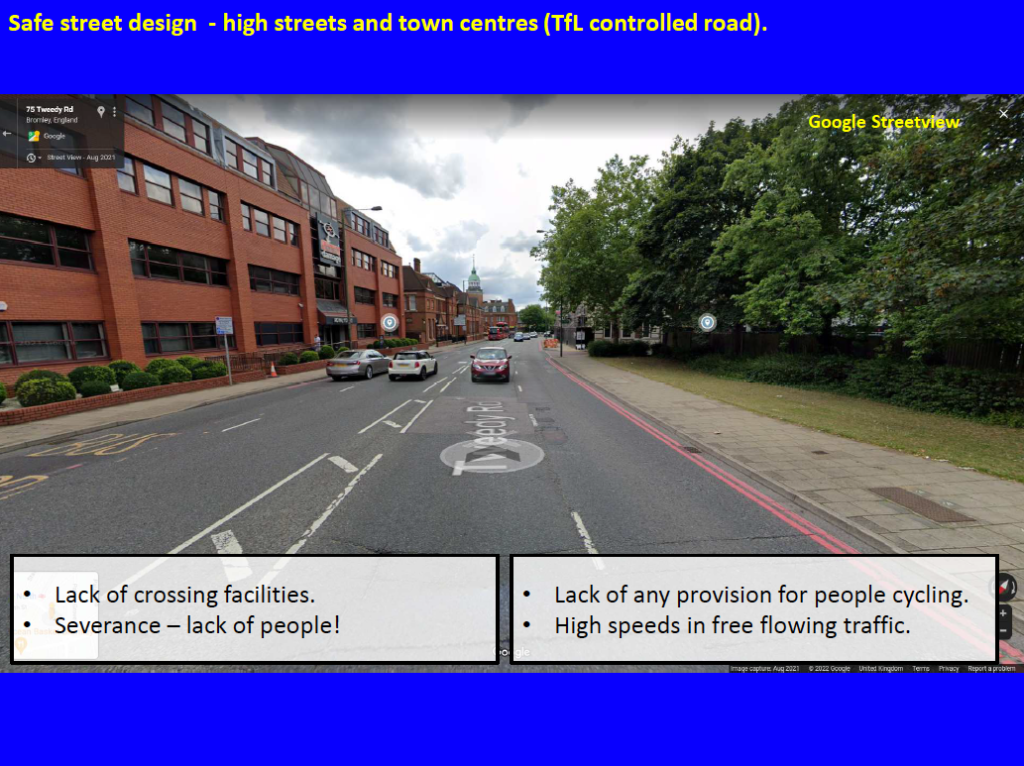
What do we need to do to start to bring walking and cycling to be more attractive and safer in Bromley? Speed is important – slower speeds are the building blocks now of fairer cities (Slide 11). Reducing the maximum vehicle speed to 20mph in built-up areas is linked with a 42% reduction in all road casualties, according to a study by the London School of Hygiene and Tropical Medicine. In built-up areas, 20mph limits are the building blocks for streets that put people first. They are linked to lower casualties, more walking and cycling, and lower air pollution and noise pollution. In terms of safe space for cycling, the key element is protected cycle lanes on main roads (Slide 12). To use a local example, Slide 13 shows the TfL route to the east of Bromley Town Centre, where improvements are needed. We see that there is a lack of crossing facilities, and this issue of severance. The photo is taken in the daytime, summer 2021, and there are no people there even though it’s close to the town centre. It’s not surprising, given the lack of any provision for cycling, and the danger and intimidation of high speeds and free-flowing traffic.
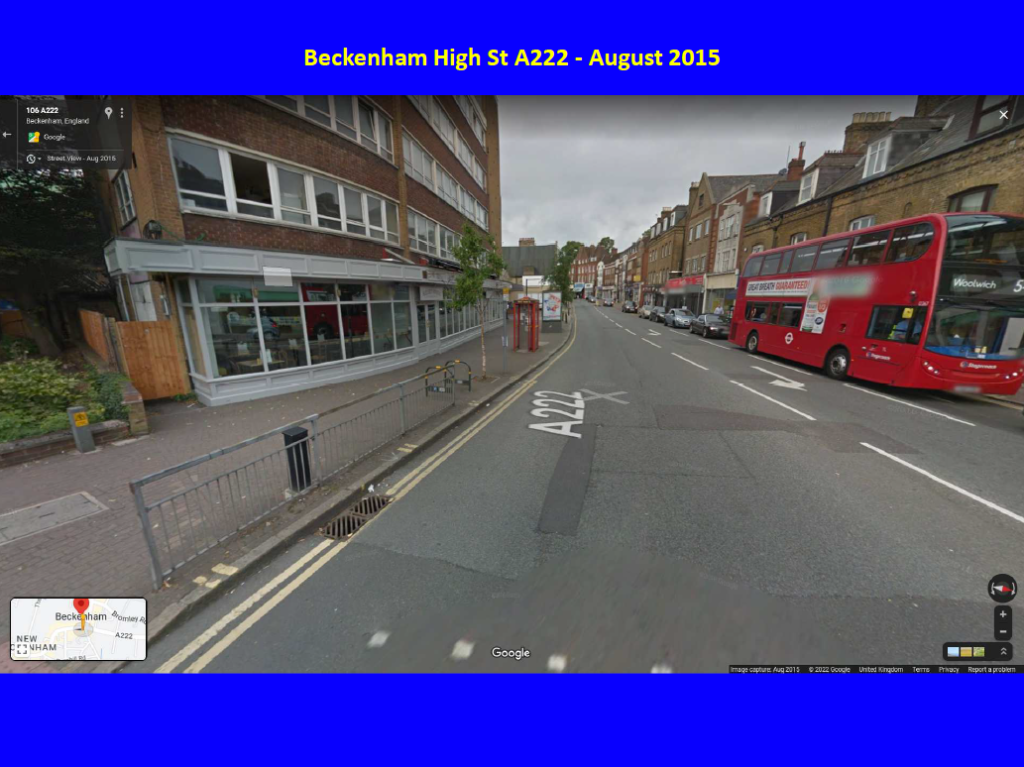
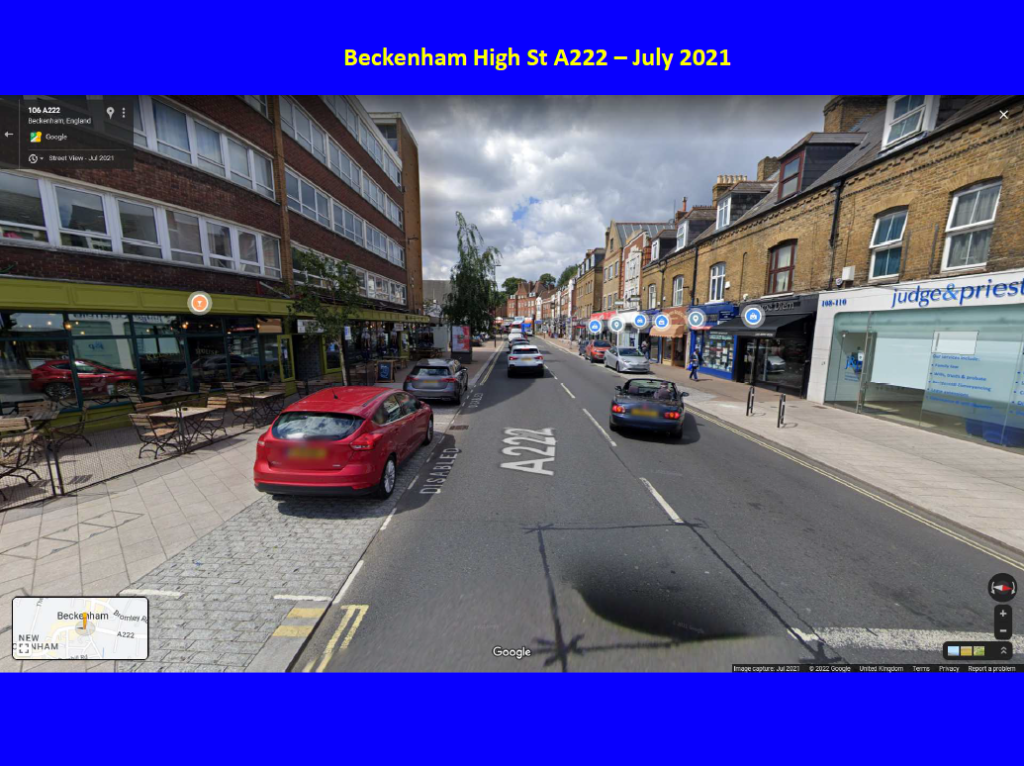
I wanted to give an example from Bromley of how things can change for the better. Slide 14 shows an image of Beckenham High Street in August 2015. You can see the condition – three lanes of road, the condition of the road is poor, it still needs a guard rail and there are not many people around. Fast forward to a street view from 2021 (Slide 15), you can see the wider pavements, the restaurant on the left is putting out seats. Presumably this was taken during a lockdown so it’s slightly devoid of life, but again, it is a much more attractive environment for people to be walking and spending time there.
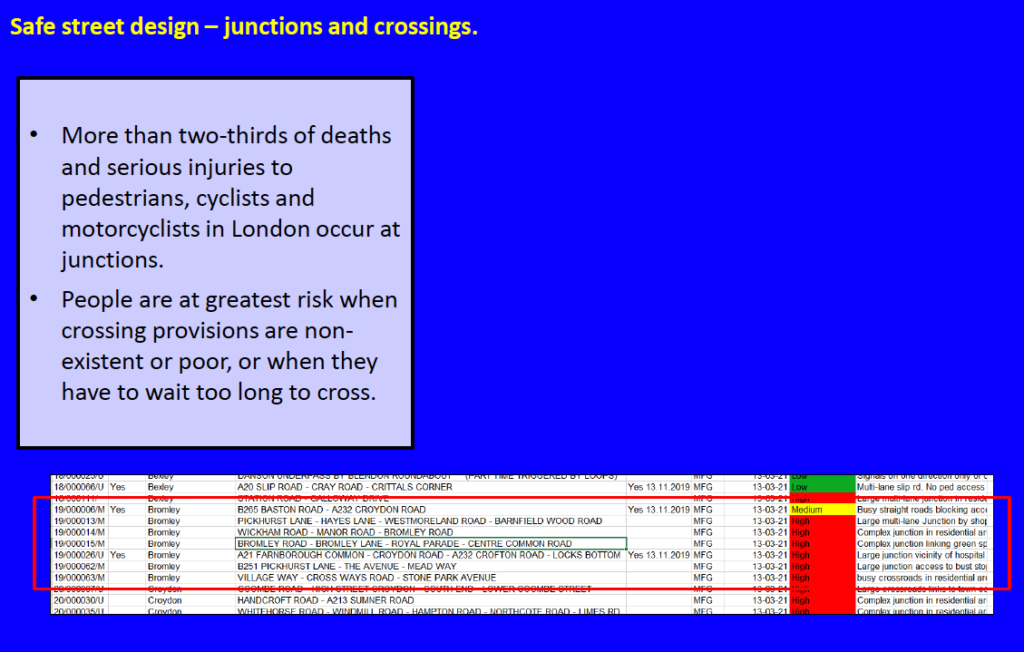
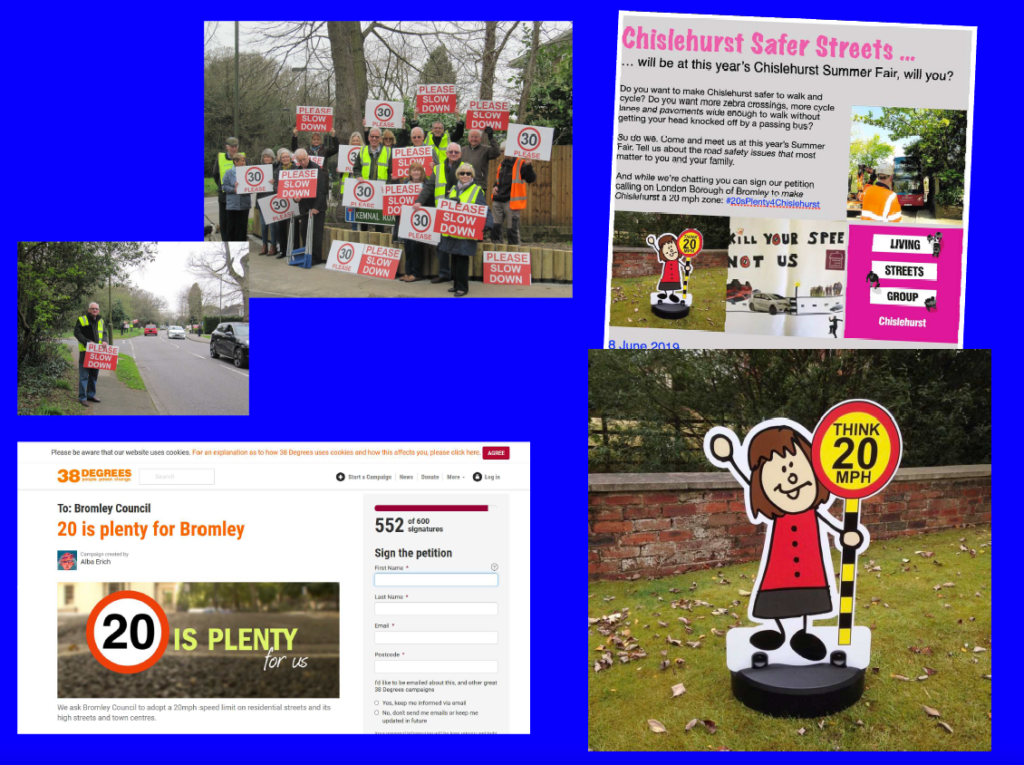
Slide 16 shows that we have, from our spreadsheet, 6-7 locations in Bromley where there is an absence of pedestrian crossing facilities at junctions. One of the most notable is the War Memorial in Chislehurst where there are no pedestrian crossing facilities at all. Slide 17 shows there is obviously a lot of demand in the borough for 20mph – with petitions and campaigns, and demands for 20mph for people to slow down.
To support liveable and walkable town centres, the 15 minute city, what do we need to do and what needs to change in Bromley? Here are some suggestions:
